Cloud Monitoring in AWS
 Image credit: Unsplash: C Dustin
Table of Contents
Important concepts & definitions in AWS CloudWatch
Standard metrics & custom metrics
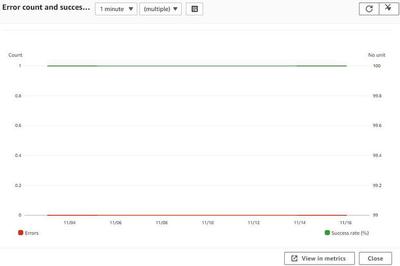
A metric represents a time-ordered set of data points that are accessible via CloudWatch. You can think of a metric as a variable that represents data points. An example of this can be the error count and success rate of a lambda function. With metrics you can get an idea about the performance and other measurable aspects of your system. Metrics are aggregable from many different AWS-Services.
A standard metric is grouped by the service name and is created automatically from scratch by AWS. The metric appears only if the service has been used in the last 15 months. They are graphically displayed by plots and are reachable via the AWS CLI or API. An example could be the CPU usage of an EC2 instance or as mentioned above the Lambda failure rate.
As the name suggests, the user can create custom metrics for an individual use case. An example of this could be a monitoring system that records how many drivers are driving without daytime running lights on a certain section of road during the day and visualizes this by summing it up in a CloudWatch metric.
Namespaces
In AWS CloudWatch, a namespace is a container for metrics. It allows to group and organize metrics so that you can more easily view and work with them. For example, you could create a namespace for metrics related to your website’s performance, and another namespace for metrics related to your database. This way, you can easily view and analyze the metrics for each area of your application without having to sift through all of the metrics together.
Standard & high resolution metrics
Amazon CloudWatch provides two different levels of metric granularity: standard resolution and high resolution.
Standard resolution metrics are stored at 1-minute intervals and are kept for 15 days. This type of metric is typically used for general monitoring purposes and provides a balance between cost and data detail.
High resolution metrics are stored at 1-second intervals and can be stored for up to 15 months. This type of metric is typically used for more detailed monitoring and troubleshooting, and provides a more detailed view of a metric’s behavior over time. High resolution metrics are more expensive than standard resolution metrics.
Alarms & Notifications
CloudWatch Alarms allow you to keep track of a single metric’s value over a set time period. If the metric value goes beyond a specified threshold, the Alarm can then trigger one or more actions such as sending notifications or automatically changing resources.
A CloudWatch Notification is a notification message that gets sent to an Amazon SNS topic or an email address when the state of an alarm changes. For instance, if the alarm is activated, the Notification will be sent to inform concerned parties.
Units & Periods
In CloudWatch, measurement and time frame for metric monitoring are defined using Units and Periods.
Units: Units in CloudWatch identify the measurement type for a metric. For instance, the metric data for CPU utilization or network traffic could be expressed in either percent or bytes per second.
Period: The Period in CloudWatch determines the length of time in seconds over which metric data is aggregated. For example, if the period is 60 seconds, the metric data will be consolidated over 60 second intervals. The Period controls the level of detail for the metric data, with smaller periods providing more detailed data and larger periods providing less detail.
Part 1
In the first part of the learning unit I got the basic knowledge about AWS CloudWatch.
The three main goals of CloudWatch are to create metrics about existing architectures or individual instances in AWS, monitoring and related logging, and creating and setting alarms. The most important basic concepts to know for working with CloudWatch are mentioned above. As a first step, I was taught independently of CloudWatch what classic log formats can look like and how to use them. I also learned how to work with specific filter patterns.
After that, I moved on to the topic of metrics and I created my first custom metric that traces employee happiness from different companies. This rather theoretical example was meant to show me how I can create my own namespaces and insert and create custom metrics there. Namespaces cannot be created via the AWS Management Console, so I performed the task using the AWS CLI.
Furthermore, I moved on to the topic of CloudWatch alarms. In doing so, I learned how to set CloudWatch alarms and what events can be executed based on those alarms. In one task, I then created an EC2 instance to track CPU usage. Prior to this, I also created an SNS topic, which reaches me via email. I subsequently created a rule under the CloudWatch events to notify me whenever the CPU utilization exceeds the 80% limit or drops below 20% in the one minute time period. On the RedHat VM, I then downloaded an application where I could artificially change the CPU utilization. Subsequently, emails were sent to me with the alarms based on this.
In a further step I went on to the topic of logging. Using different tasks I learned about the different ways to log events, for example in Lambda functions. The easiest way to do this is by using a print-statement, with which you can log a value of a variable for example. Another way is to use the Python package logging, which gives you different possibilities for logging. Finally I learned how to use AWS-Powertools-for-Python, which makes logging much easier.
At the end, I learned how to create my own dashboards and create and configure widgets from standard or custom metrics.
UseCase of CloudTrail
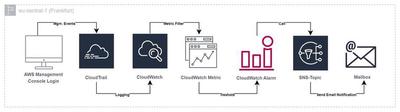
A helpful use case of CloudTrail could certainly be tracking login activities in the own AWS account. In case that someone improperly gains access to an account the owner can see the activity and has the possibility to intervene directly if it is noticed in time. To improve this even further, one could, for example, create a CloudTrail that tracks management events. This also includes the event “ConsoleLogin”. In the specific CloudTrail, a logstream could then be created that sends the events to CloudWatch and creates a log group there. A metrics filter can then be set up in CloudWatch, which filters the logs according to the variable EventType = “ConsoleLogin” and generates a corresponding metric and an associated metric value (int=1). Once the metric has been successfully created, a CloudWatch alert can be created that will be triggered whenever new login activity occurs. The metric alarm is kept according to the “Maximum” statistic and is given a threshold value of 1. Thus, every time the value is greater than or equal to 1, an alarm is triggered. An SNS topic can be added to the alarm afterwards, which will contact the user via email or SMS, for example. The architecture for this is shown in the following graphic.
CloudTrail Lake
CloudTrail Lake is an extension of the traditional CloudTrail Trails. AWS itself describes it as “…a managed audit and security lake that allows you to aggregate, immutably store, and query your activity logs for auditing, security investigation, and operational troubleshooting.” (from the blog post announcing CloudTrail Lake). The main difference is that a lake, unlike a conventional trail, is created in the form of a data store in which events are stored during a desired time period in the form of a table. The data records can then be queried with SQL query statements and, if necessary, processed further. One notable benefit of CLoudtrail Lake is that you can collect data a cross regions and across multiple accounts that reside within an AWS organization.
As an exercise I have created the following SQL statements:
SELECT * FROM <event-data-store-ID>
WHERE eventName = 'ConsoleLogin'
SELECT userIdentity.arn, COUNT(*) AS loginCount
FROM <event-data-store-ID>
WHERE eventName = 'ConsoleLogin'
AND eventTime > '2023-02-28 00:00:00'
GROUP BY userIdentity.arn
ORDER BY count(*) DESC
The first statement lists all events, where the eventName is equal to the management event “ConsoleLogin”. The second statement is used to determine which user has logged into the console the most during the last week.
---